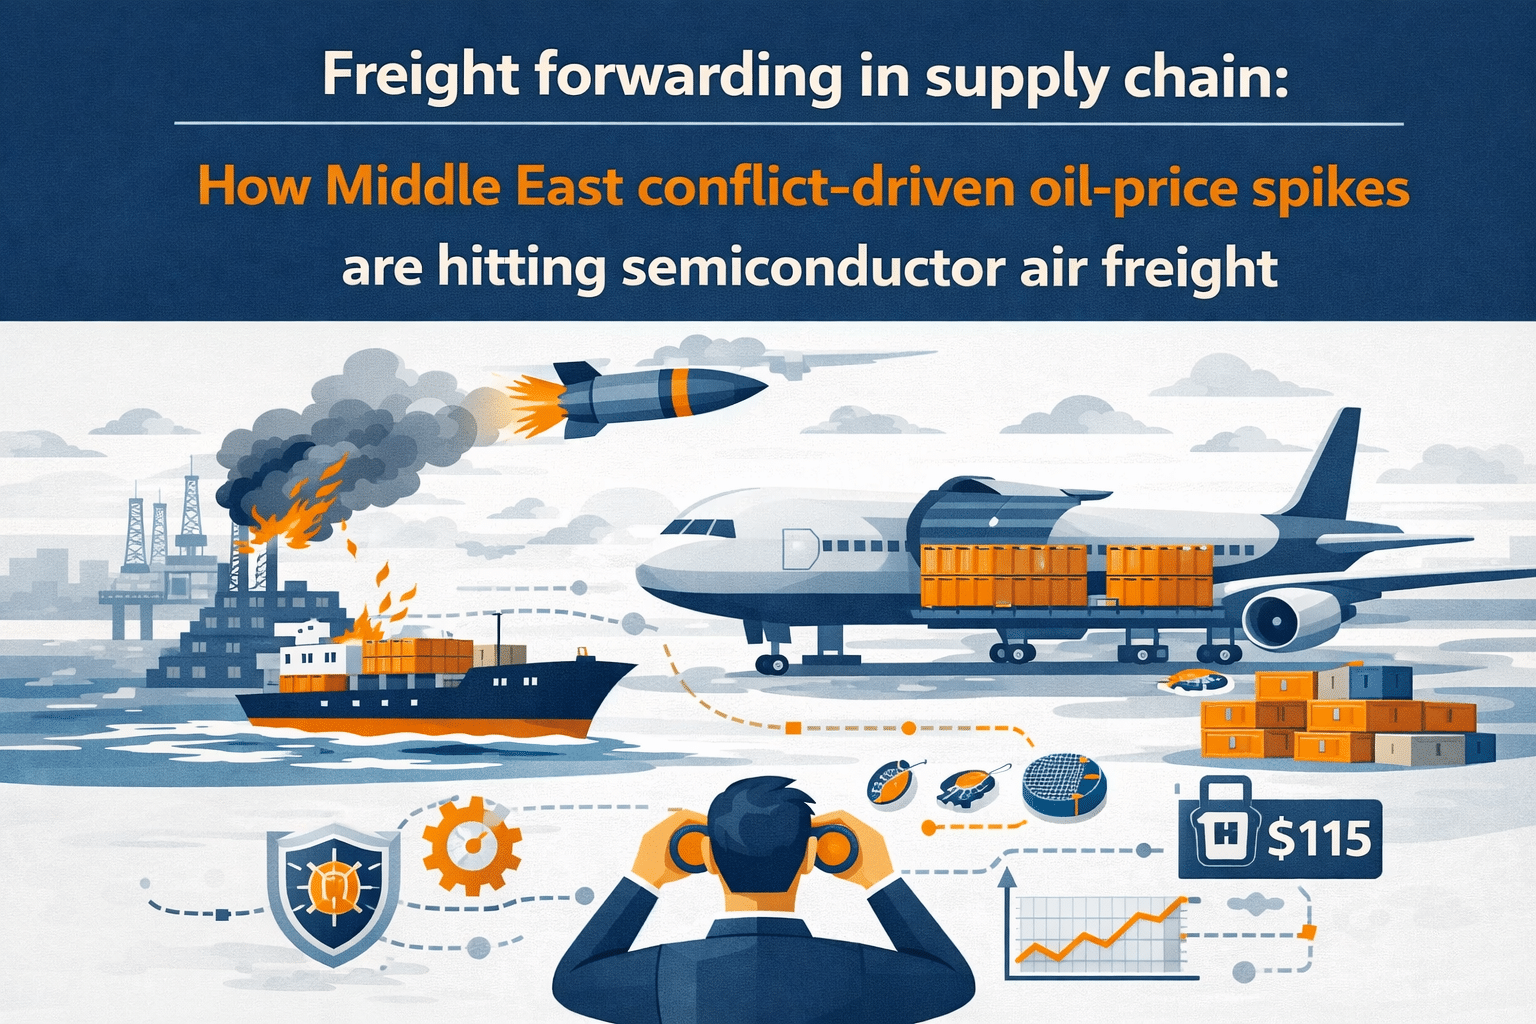
Freight forwarding in supply chain: How Middle East conflict–driven oil-price spikes are hitting semiconductor air freight
Jet fuel has risen 57 percent in less than three weeks, and semiconductor air freight budgets are already absorbing the impact. Asia–Europe lanes face longer routings, tighter capacity and volatile surcharges at a moment when production sites cannot risk idle tools or delayed restarts. This article outlines where oil driven cost increases and route disruptions are affecting semiconductor flows, where gaps remain in available data, and how freight forwarding strategies can adapt to protect service continuity and margin. The question is no longer whether the conflict will affect global networks, but how quickly organisations can quantify the impact and adjust their air, sea and multimodal planning.
Immediate impact on semiconductor logistics: cost shifts, capacity pressure and route disruptions
As the Middle East conflict enters its third week, the cost and capacity environment for semiconductor air freight has changed significantly. Jet fuel reached 3.93 dollars per gallon on 17 March 2026 versus 2.50 dollars before hostilities escalated on 28 February. This increase, linked to disrupted oil flows near the Strait of Hormuz, is feeding directly into air cargo rate adjustments on Asia–Europe and other long haul lanes.
Semiconductor and electronics supply chains rely on predictable air transport to secure high value inventory and tight production cycles. Higher surcharges immediately increase landed costs per wafer, die or module, while rerouting and congestion amplify schedule variability on routes that previously operated with consistent transit times.
Airspace restrictions and risk zones are reducing long haul capacity. Global air cargo lift is down by about 18 percent, with Asia–Middle East–Europe corridors declining around 26 percent. Rerouted flights take longer, consume more fuel and further raise cost exposure for semiconductor shipments.
Ocean carriers are also diverting vessels away from high risk areas, adding days or weeks to transit times. When maritime schedules slow, urgent semiconductor cargo shifts to air, reinforcing pressure on limited capacity and contributing to higher spot rates and extended booking lead times.
Recent reporting notes that the current situation is creating severe strain on Europe–Asia aviation networks. Sea–air hubs serving high tech production in Asia and the Gulf face reduced frequencies and revised routings. European automotive manufacturers are preparing for additional logistics pressure, which may further tighten air capacity used by semiconductor shippers.
Public data continues to show gaps. Market coverage often highlights capacity reductions and fuel price changes but provides limited detail on lane specific rate movements for temperature controlled or high security air freight. Visibility on built‑in schedule buffers is inconsistent, and the application of these buffers varies across carriers.
Another area that lacks coverage is the link between energy markets and manufacturing power costs in East Asia. Global gas price movements are influencing electricity tariffs in locations such as Taiwan, affecting fab operating costs while logistics costs also rise. These combined pressures affect sourcing and inventory decisions, yet they are often treated as independent trends.
Current reporting also emphasises headline disruptions rather than lane level reliability metrics. For semiconductor flows, the practical questions concern cancellation frequency, extended routing times and the pace at which urgent ocean cargo is shifting into air. Without systematic data, logistics teams must rely on fragmented updates when adjusting freight forwarding strategies.
Mitigation approaches for freight forwarders and shippers: modal planning, consolidation, routing and surcharge management
Oil driven cost pressure and constrained capacity on Asia–Europe semiconductor lanes require structured response plans rather than isolated fixes. Semiconductor logistics depend on predictable air transport, so fuel price changes immediately influence surcharges and lead times. A coordinated mitigation programme should combine modal planning, consolidation, routing diversification, inventory adjustments and structured discussions on surcharge mechanisms.
Modal shift: air, sea and multimodal rebalancing
To manage rising air freight costs and network disruption, forwarders and shippers are rebalancing transport modes. Where feasible, flows shift from air to sea, and where ocean schedules are unreliable, rail or road legs can stabilise transit times. Clear thresholds help determine which semiconductor products require air transport and which can move through slower modes without jeopardising production.
On affected Asia–Europe corridors, alternative sea–air or rail–air combinations can bypass congested hubs. Pre‑agreed modal mixes reduce last minute premium bookings and support continuity for core production programmes.
- Segment flows by value density, sensitivity to delay and associated penalties
- Define service tiers such as pure air, sea–air, rail–air and deferred ocean
- Prebook capacity through gateways outside the most exposed hubs
- Align contractual terms to support modal changes
- Share updated transit time and cost scenarios with planning teams
Consolidation and load building tactics
Building full loads reduces per unit transport cost and stabilises uplift. Planned air consolidations around fixed departures support rate consistency and capacity access. Effective consolidation requires coordinated purchase orders, production releases and outbound schedules.
Cross supplier or cross plant consolidation can further stabilise load factors where contracts permit. Shared demand visibility across business units improves planning windows and reduces reliance on urgent spot bookings.
Routing redesign and network diversification
The current disruption highlights the risk of relying on single hub strategies. Mapping each semiconductor lane by origin, destination, carrier and hub helps identify alternative routings that maintain security and temperature requirements while avoiding high exposure corridors.
Diversification may include shifting volumes to secondary hubs, using non Gulf sea–air combinations or routing through rail corridors where feasible. Clear booking rules ensure consistent implementation among planners and forwarders.
Inventory and distribution adjustments
Targeted inventory changes can stabilise service levels. Semiconductor networks should distinguish between die banks, test and assembly locations and distribution centres. Safety stock increases should be selective and focused on volatile transport legs.
Revised reorder points and postponement strategies can align stocking locations with both logistics risk and energy driven manufacturing constraints. This avoids excessive working capital while reducing the risk of production stoppages.
Surcharge strategy and commercial levers
Structured discussions on surcharge mechanisms can help manage cost volatility. Linking surcharges to transparent indices and service commitments provides a clearer basis for negotiations. Longer term allocations or flexible routing options can support moderated surcharge structures.
Customer contracts may also need review, particularly where strict delivery windows apply. Transparent data on fuel price movements and capacity constraints can support revised service levels or cost sharing mechanisms.
Decision framework for air, sea and multimodal choices: tradeoffs, risk scoring and contract considerations
With higher oil prices and extended air transit times, a structured comparison of air, sea and multimodal options is essential. A lane by lane matrix that maps value density, demand volatility and time sensitivity provides a clear starting point. High value or line critical components may continue to require air or fast sea–air, while lower value or stable demand items can shift to slower modes.
Cost versus lead time tradeoffs
The evaluation should quantify whether the premium for air transport remains justified once new delay probabilities are included. Extended air transit times reduce the gap between modes, which changes the financial logic of modal decisions. Scenario modelling across air, sea and sea–air options clarifies total landed cost implications.
| Mode | Indicative lead time (Asia–Europe) | Relative transport cost | Typical use case in semiconductor flows |
|---|---|---|---|
| Air | 3 to 7 days | Highest, exposed to oil price changes | Wafer lots, high value ICs, urgent production support |
| Multimodal (sea–air, rail–air) | 10 to 20 days | Medium | Time sensitive but not emergency requirements |
| Sea | 25 to 40 days | Lowest | Buffer stock, lower value components, stable demand flows |
This comparison helps determine whether the air premium is still justified given current variability. The ongoing shift of urgent cargo from maritime routes to air continues to influence capacity and should be factored into ROI calculations.
Capacity and risk assessment
A simple risk score for each lane supports consistent decisions. Key factors include exposure to affected regions, fuel surcharge volatility, carrier dependence and the resilience of alternative routes. Semiconductor volumes that rely on hubs in the conflict area are more exposed to further schedule restrictions.
Risk scoring should include supply side stability indicators and demand side service requirements. Automotive manufacturers anticipating scheduling pressure may tighten delivery windows, increasing the cost of delay and shifting the balance toward air or multimodal options.
- Map primary and backup routings for all modes
- Assign qualitative risk levels for conflict exposure and capacity tightness
- Estimate the impact of a one week delay for each product family
- Prioritise secure air capacity for lanes where delay cost outweighs the premium
- Shift lower priority flows to slower modes
- Review the mapping monthly during the disruption
Volatile energy prices in East Asia add an additional variable, influencing production schedules and creating demand fluctuations that must align with planned capacity allocations.
Contract negotiation checklist
Relying solely on spot buying is risky in the current context. Contracts should secure predictable access to capacity without locking in rigid volumes or surcharge structures. Flexibility and transparency are central to negotiation.
Forwarders able to provide clear surcharge mechanisms, alternative routing options and consistent mode switching will support more resilient operations than those offering short term rate reductions. Contract wording should specify how capacity and pricing will adapt if conditions worsen.
- Define tiered volume commitments with the ability to reallocate
- Request transparent surcharge formulas with review triggers
- Include service level targets for reliability on key lanes
- Secure contingency routings outside the most exposed hubs
- Negotiate mode switching options during congestion
- Request regular risk and capacity updates
- Align terms with internal ROI thresholds for modal choices
As urgent cargo continues to shift from maritime to air, semiconductor logistics will remain under pressure. A clear decision framework that combines tradeoff analysis, risk assessment and structured contracting supports more stable operations during the current Middle East related volatility.